Lyft Bike Rideshare Data Analysis
In one of the data mining classes at school, two of my group members and I built a model that would reveal the demographics of casual customers and subscribers of Lyft bike rideshare service called Bay Wheels. We extracted data in February 2020 (pre-pandemic), September, and October 2020 (during the pandemic) directly from Lyft to examine any shifts during the timeframe.
project abstract
Bay Wheels is a rideshare service provided by Lyft in San Jose, Oakland/Berkeley area, and San Francisco. Users rent a bike at a bike station and drop it off at a bike station closest to their destination.
There are two types of users: casual customers and subscribers. Casual customers pay $2 to unlock a bike while subscribers have free unlocks. To the right is the comparison of those two types of users.
We used the Random Forest tree classifier to uncover intricacies between casual customers and subscribers’ behaviors if any.


Comparison of Bike Rideshare usage in the Bay Area by Days of Week
Overall, the number of usages dramatically decreased from February to October 2020. One thing to note is that the usage in February sees its peak on Thursday while the usage in October has the highest count on Saturday. Our educated guess was that since the pandemic caused many jobs to be mainly virtual, the purpose of Bay Wheels shifted from commute transportation mode to leisure travel on weekends.
Early Data Analysis
To the left are some graphs and maps that we believed it was worth noting to better capture the change in demographics of Lyft Bay Wheels usage.

Comparison of Casual Customers and Subscribers
In February, subscribers consisted nearly double the number of casual customers. On the other hand, in September and October, casual customers became more popular than subscribers. This may be correlated to a large group of population leaving the Bay Area (especially San Francisco) due to the pandemic.

Using Tableau, we created the maps visualizing the change in the number of ride usage between September (left) and October (right). Even during the midst of the pandemic, you see that there is a significant decrease in the rideshare between these two months. Each dot represents the position of the bike statations, and the number of trips started from the stations is recorded here.
Random Forest Decision Tree
Below is the decision tree we have created. The darkness of the colors correlates to the “purity” of each group, customer (orange) and subscribers (blue). This is the decision tree that resulted in the highest accuracy score after adjusting multiple hyperparameters, such as the minimum number of sample splits and the maximum depth of a tree.

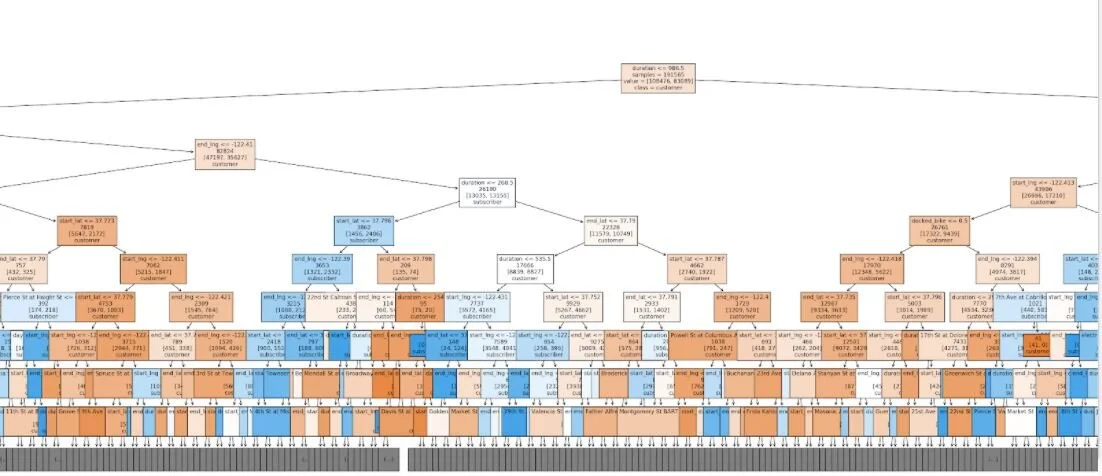

The accuracy rate of this model resulted in 70.4%. As the tree above shows, there are many branches—so many that we cannot see the description of the end of the branches. An example of the characteristics we saw from the decision tree is that users with a duration of fewer than 30 minutes have a high purity of subscribers.
Though the project might have derived more questions than answers, we can pose a couple of valuable questions:
Should Lyft be shifting its focus on putting bike stations in more suburban areas as opposed to metropolitan areas?
Looking at the demographics who tend to be casual customers, how can Lyft commit to target-marketing to increase the number of subscribers?
How are the demographics of users of competitors, such as Uber and Bird?